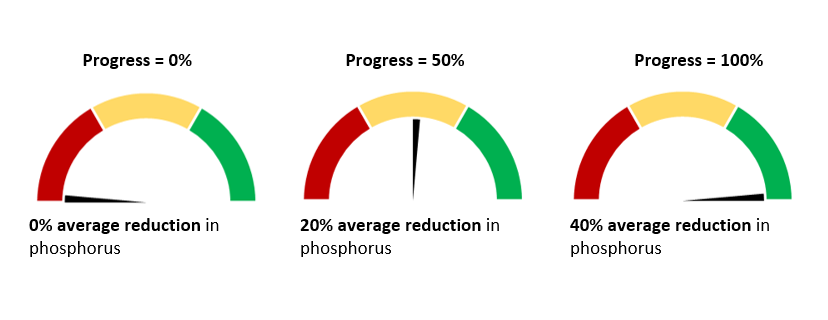
Progress toward the 40% phosphorus load reduction goal is tracked through several metrics. Each progress gauge shows progress relative to the 40% target. As you see with the sample gauges below, a 20% phosphorus reduction would be halfway toward the target, so would be shown as 50% progress on the gauge. Similarly, reaching the 40% reduction target would mean the progress gauge is at 100%. Progress toward each phosphorus loading metric is included in the overall goal progress gauge by averaging the progress values.

Tracking progress toward phosphorus in spring (reducing harmful algal blooms) metric: how it’s calculated
The U.S. and Canada adopted targets to reduce spring phosphorus loading by 40 percent from priority tributaries to control harmful algal blooms in the western Lake Erie basin. Progress is calculated by comparing the average reduction over the last five years toward the 40 percent reduction target.
A gauge indicator all the way to the left would indicate no reduction in average spring phosphorus, while an indicator gauge pointed all the way to the right would represent an average 40% reduction in spring phosphorus over the last five years.
Reductions in both total phosphorus (TP) and soluble reactive phosphorus (SRP) are important to reducing harmful algal blooms. Phosphorus loads are influenced by the flow of the river, so another important indicator is the flow-weighted mean concentration, which normalizes for flow and can be used as a benchmark to track progress in load reductions. To provide a comprehensive view of progress toward spring phosphorus reduction, the progress dial represents an average of the reductions in spring TP load, spring SRP load, spring TP FWMC, and spring SRP FWMC. For tributaries that do not have targets established for all four of the metrics, only metrics with available targets are included in the average.
Progress is being tracked at three scales:
- Lake Erie sub-basin: Gauge depicts phosphorus reductions from all Western Lake Erie Basin priority tributaries (phosphorus loads are summed and the average reduction is calculated from the summed phosphorus loads; phosphorus FWMCs are averaged and the average reduction is calculated from the average phosphorus concentrations)
- State/provincial level: Gauge depicts phosphorus reductions from priority tributaries entirely or partially within individual jurisdiction (phosphorus loads are summed and the average reduction is calculated from the summed phosphorus loads; phosphorus FWMCs are averaged and the average reduction is calculated from the average phosphorus concentrations)
- Priority tributary: Progress toward the 40% reduction target at each priority tributary is shown beneath the gauge
Tracking progress toward annual phosphorus (reducing hypoxia) metric: how it’s calculated
The U.S. and Canada adopted targets to reduce annual phosphorus loading by 40 percent from priority tributaries to control hypoxia in the central Lake Erie basin. Progress is calculated by comparing the average reduction over the last five years toward the 40 percent reduction target.
A gauge indicator all the way to the left would indicate no reduction in average annual phosphorus loading, while an indicator gauge pointed all the way to the right would represent an average 40% reduction in annual phosphorus loading over the last five years.
Progress is being tracked at three scales:
- Lake Erie sub-basin: Gauge depicts phosphorus reductions from all Lake Erie Basin priority tributaries (phosphorus loads are summed and the average reduction is calculated)
- State/provincial level: Gauge depicts phosphorus reductions from priority tributaries entirely or partially within individual jurisdiction (relevant phosphorus loads are summed and the average reduction is calculated)
- Priority tributary: Progress toward the 40% reduction target at each priority tributary is shown beneath the gauge
Tracking progress toward total phosphorus load metric: how it’s calculated
The U.S. and Canada adopted targets to reduce annual phosphorus loading to the western and central Lake Erie basins by 40 percent to control hypoxia in the central Lake Erie basin. This load includes all tributaries (including unmonitored areas), atmospheric deposition, and input from Lake Huron. Progress is calculated by comparing the average reduction over the last five years toward the 6,000 metric ton target – approximately a 40% reduction from the 2008 load.
A gauge indicator all the way to the left would indicate no reduction in average annual phosphorus loading, while an indicator gauge pointed all the way to the right would represent an average 40% reduction in annual phosphorus loading over the last five years.
Progress is being tracked at the basin-wide scale, looking at the total load from all sources.
Tracking progress toward strategies to reduce phosphorus metric: how it’s calculated
Under the Great Lakes Water Quality Agreement, jurisdictions in the western and central Lake Erie basins were required to develop Domestic Action Plans (DAPs) to establish strategies to meet the phosphorus reduction targets. Progress is determined by whether jurisdictions have fulfilled their requirements in developing a DAP. Success in controlling sources of phosphorus to Lake Erie should alleviate harmful algal blooms and hypoxia in the western and central basins, respectively. Progress toward this metric is not included in the overall goal progress gauge.
