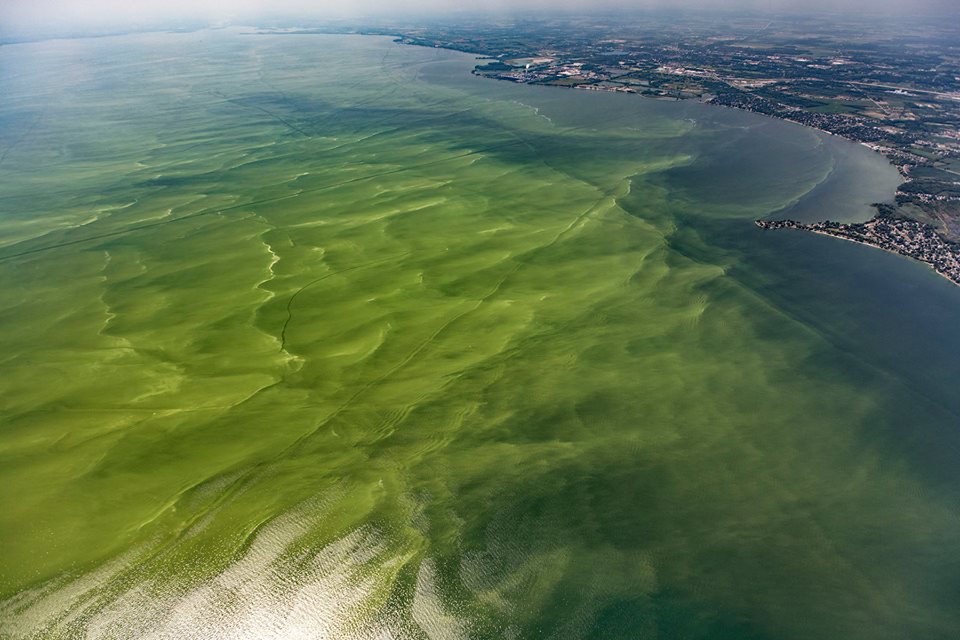
Phosphorus in spring
Photo: Aerial Associates Photography, Inc. (Zachary Haslick) via NOAA GLERL
GOAL: Reduce the amount of phosphorus entering the western and central basin of Lake Erie by 40 percent (from 2008 levels) / METRIC: Phosphorus in spring

What we track
Amounts of phosphorus contributed to Lake Erie by eight priority rivers in the spring (March 1 through July 31) are tracked by year.
ErieStat presents information as both loads (the total amount of phosphorus entering the lake from a river) and flow weighted mean concentration or FWMC- which standardizes the measure of phosphorus delivery from a river so that performance can be compared across years and rivers despite different flows. For example, in a dry year the load may be low due to less runoff from precipitation, but the FWMC will still be high if the phosphorus concentration in that runoff is high.
Phosphorus in the spring & the Maumee River
The Maumee River basin, which includes land in Ohio, Indiana, and Michigan has been found to be the leading contributor of phosphorus to Lake Erie in the spring.
Why it matters
Toxic and nuisance algal bloom occurrences in Lake Erie have increased since the beginning of the century. Phosphorus contributed to the western basin in the spring, especially soluble reactive phosphorus, has been found to drive the growth of harmful algal blooms in late summer. The blooms threaten drinking water quality and increase costs associated with treatment. Tourism activities are impacted as recreational users avoid the lake.
Source:
ErieStat Work Group
Spring Phosphorus Targets

The U.S. and Canada set phosphorus reduction goals (40 percent of 2008 loads) for eight priority tributary watersheds for both total and soluble reactive phosphorus (SRP) during March-July. SRP refers to phosphorus that is in a dissolved state and is of particular interest because it is the easiest form of phosphorus for algae to use to fuel growth. The targets for these tributaries are expressed in terms of the flow weighted mean concentration (FWMC) – which is a way to normalize the load for flow. This is important because much of the load is delivered during storm events. It means that efforts to reduce the load must also include efforts to reduce the amount of flow (runoff). FWMC also provides an important backstop and relative measure of whether phosphorus control efforts are actually having an impact. For example, in a dry year the load may be low due to less runoff, but the FWMC will still be high if the proportion of phosphorus in that runoff is high. The calculation of spring load requires high frequency flow and water quality monitoring, which is now in place for all nearshore priority tributaries. Not all tributaries had monitoring in place going back to 2008. Click on the watershed of interest to see available data.
Source:
Data are provided to the Great Lakes Commission through the GLWQA Annex 4 subcommittee
| River | Water Year | TP Load | SRP Load | TP FWMC | SRP FWMC |
|---|---|---|---|---|---|
| Portage River | 2022 | Target met | Target met | Target not met | Target not met |
| River Raisin | 2022 | Target not met | No target | Target not met | No target |
| Maumee River | 2022 | Target not met | Target not met | Target not met | Target not met |
| Sandusky River | 2022 | Target not met | Target not met | Target not met | Target not met |
| Cedar Toussaint Complex | 2022 | No target | No target | No target | No target |
| Huron River (OH) | 2022 | No target | No target | No target | No target |
| Leamington Tributaries | 2022 | No target | No target | No target | No target |
| Thames River | 2022 | No target | No target | No target | No target |
Source:
ErieStat Work Group