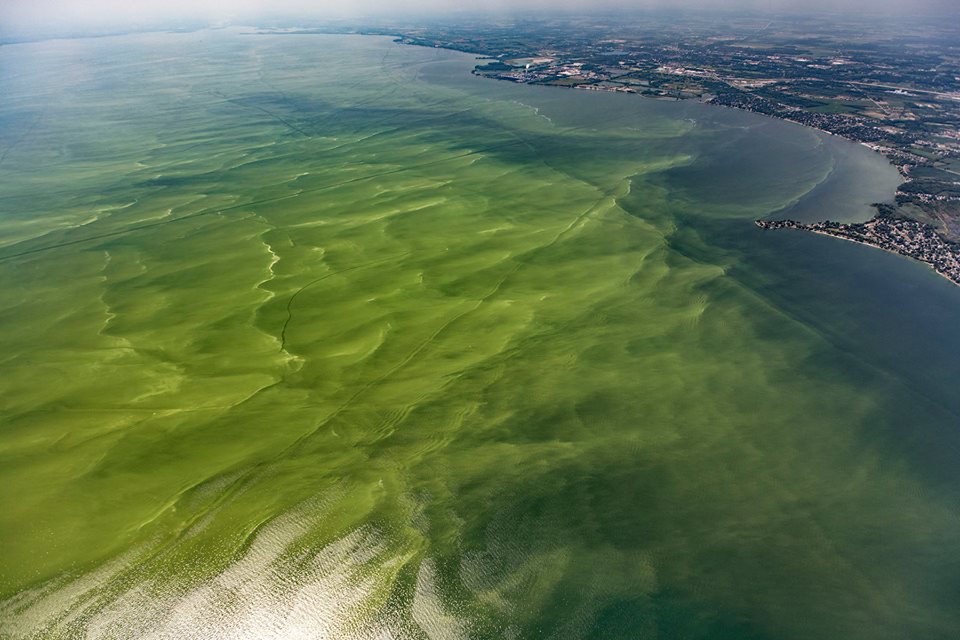
Harmful Algal Blooms
Photo: Aerial Associates Photography, Inc. (Zachary Haslick) via NOAA GLERL
GOAL: Reduce the amount of phosphorus entering the western and central basin of Lake Erie by 40 percent (from 2008 levels) / METRIC: Harmful Algal Blooms

What we track
The annual severity index for the cyanobacterial harmful algal bloom (HAB) in Lake Erie, as determined by the U.S. NOAA National Centers for Coastal Ocean Science
Lake Erie Harmful Algal Bloom Severity
In 2015, Annex 4 of the 2012 Great Lakes Water Quality Agreement set a target of a 40% reduction in the total phosphorus and dissolved reactive phosphorus loads from priority Lake Erie tributaries between March and July, with the end goal of achieving a bloom severity no worse than the one that occurred in 2012 for 9 out of 10 years. NOAA’s annual HAB severity index, which is based on the average of the three highest HAB magnitudes over 10-day periods, provides a means of tracking that response indicator. The NOAA HAB severity index for Lake Erie is calculated based on ocean color imagery collected by the Copernicus Sentinel-3 satellite mission and processed by NOAA.
Why it matters
Excessive growth of cyanobacteria, also referred to as blue-green algae, in Lake Erie poses significant threats to the ecosystem as well as human health; the lake is a source of drinking water for 12 million people in the U.S. and Canada. Harmful algal growth has increased significantly in the past 10 years, in large part because of high levels of nutrients, specifically phosphorus that is delivered from major rivers during spring storms. The HAB severity index allows decision-makers to track how Western Basin cyanobacterial blooms respond to changes in phosphorus load and to make more informed decisions about phosphorus load management in the Lake Erie Basin.
Source:
Great Lakes Water Quality Agreement Annex 4 Objectives and Targets Task Team Final Report to the Nutrients Annex Subcommittee. May 11, 2015
NOAA NCCOS Lake Erie Harmful Algal Bloom Forecasts
Calculated annually by NOAA, the HAB Severity Index is based on a bloom’s biomass- the amount of algae- over a sustained period. Federal, state, and provincial governments agreed that Western Lake Erie Basin algal blooms similar to the 2012 bloom would be acceptable for nine years out of ten. Under NOAA’s index, the 2012 year is 2.9. Although the size of a bloom isn’t necessarily an indication of how toxic the bloom is, the severity index helps to assess conditions in comparison to 2012. An index score above 4 indicates a significant bloom. The largest blooms to date have occurred in 2011 with a severity index of 10, and 2015, at 10.5. In 2023, the severity index was 5.3, which NOAA considers "moderately severe."
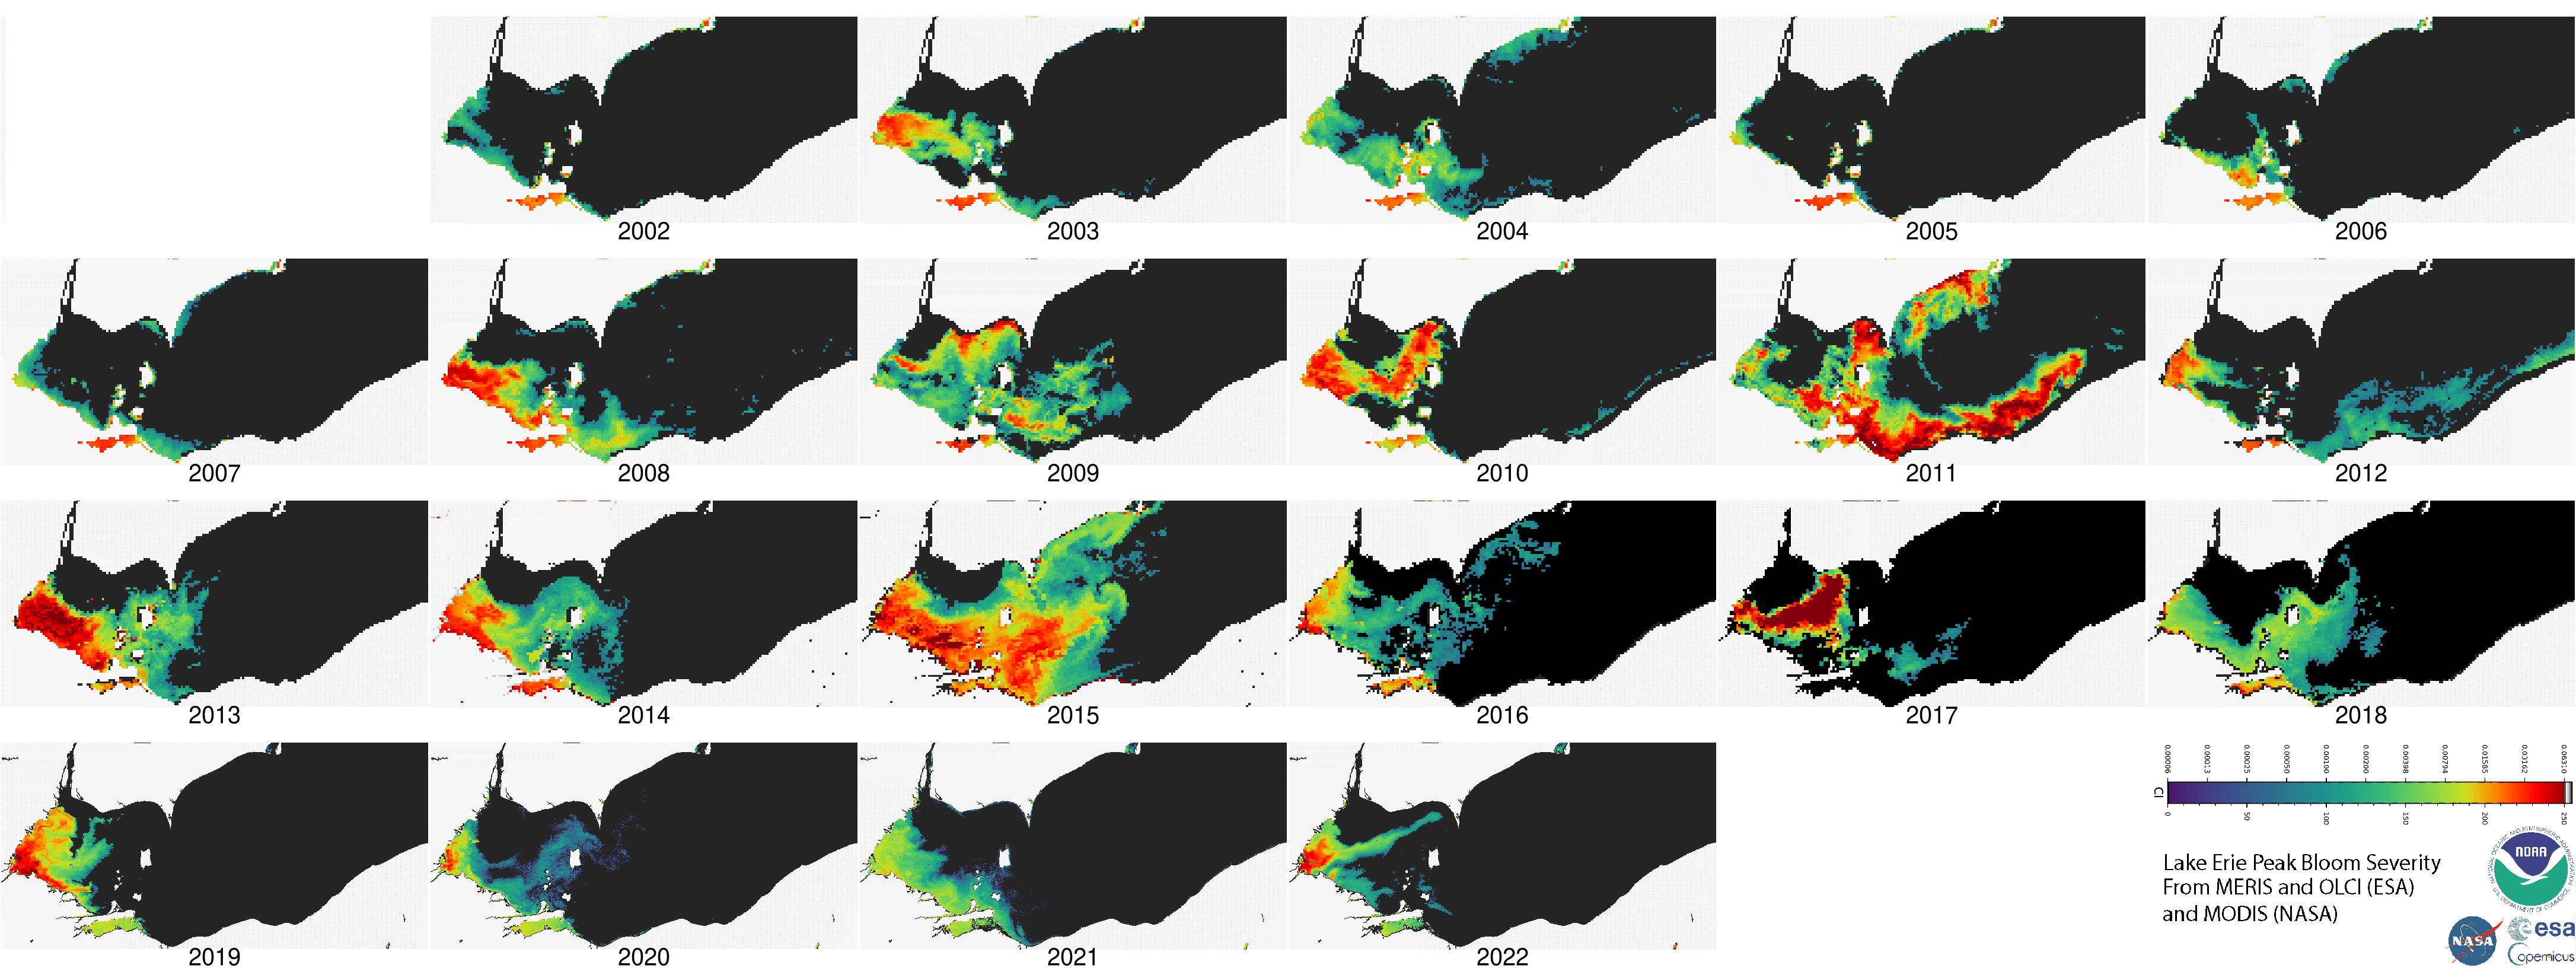
Lake Erie Harmful Algal Bloom Severity over Time
Specific types of satellite imagery can provide data on the areal extent of cyanobacterial blooms. Data from sensors like those aboard the MERIS and Sentinel-3 satellites can quantify the biomass of cyanobacteria in the lake even when the water is turbid. The cyanobacteria that produce harmful microcystin can be differentiated from other algae in the lake based on how the cells reflect light at certain wavelengths.
This kind of data has been collected via satellite since 2002, allowing researchers to track how the surface area and intensity (biomass) of the HAB in western Lake Erie has changed over the past 20 years. The figure below shows what the bloom in western Lake Erie has looked like at the peak of its severity in each of those years, where warmer colors correspond to higher concentrations of algae cells.