Phosphorus throughout the year
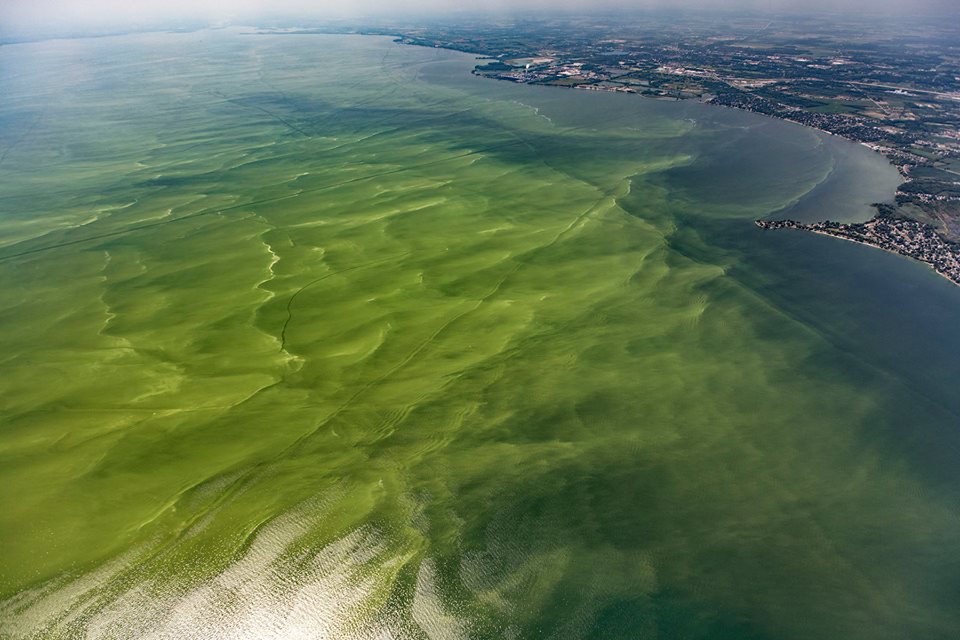
Photo: Aerial Associates Photography, Inc. (Zachary Haslick) via NOAA GLERL
GOAL: Reduce the amount of phosphorus entering the western and central basin of Lake Erie by 40 percent (from 2008 levels) / METRIC: Phosphorus throughout the year

What we track
Annual amounts of phosphorus contributed to Lake Erie by ten priority rivers to the western and central basins of the lake.
Total phosphorus throughout the year
Modeling suggests that annual total phosphorus loads influence the extent and intensity of hypoxia (low oxygen) in the central basin of Lake Erie. Limiting the annual total phosphorus load is thought to keep the oxygen concentrations in the bottom waters of Lake Erie at an acceptable level. Loads are tracked at ten priority tributaries, including the binational Detroit River, and are also estimated for the entire western and central basin. Efforts to control phosphorus through Domestic Action Plans are intended to help jurisdictions collectively achieve the target of 6000 metric tons of total phosphorus (or less) contributed to Lake Erie.
Why it matters
Achieving the target should help reduce the hypoxic or low-oxygen zone that forms each summer in Lake Erie’s central basin. Low-oxygen conditions, called hypoxia, can harm aquatic life and create difficulties in treating drinking water.
Source:
ErieStat Work Group
Annual Phosphorus Targets
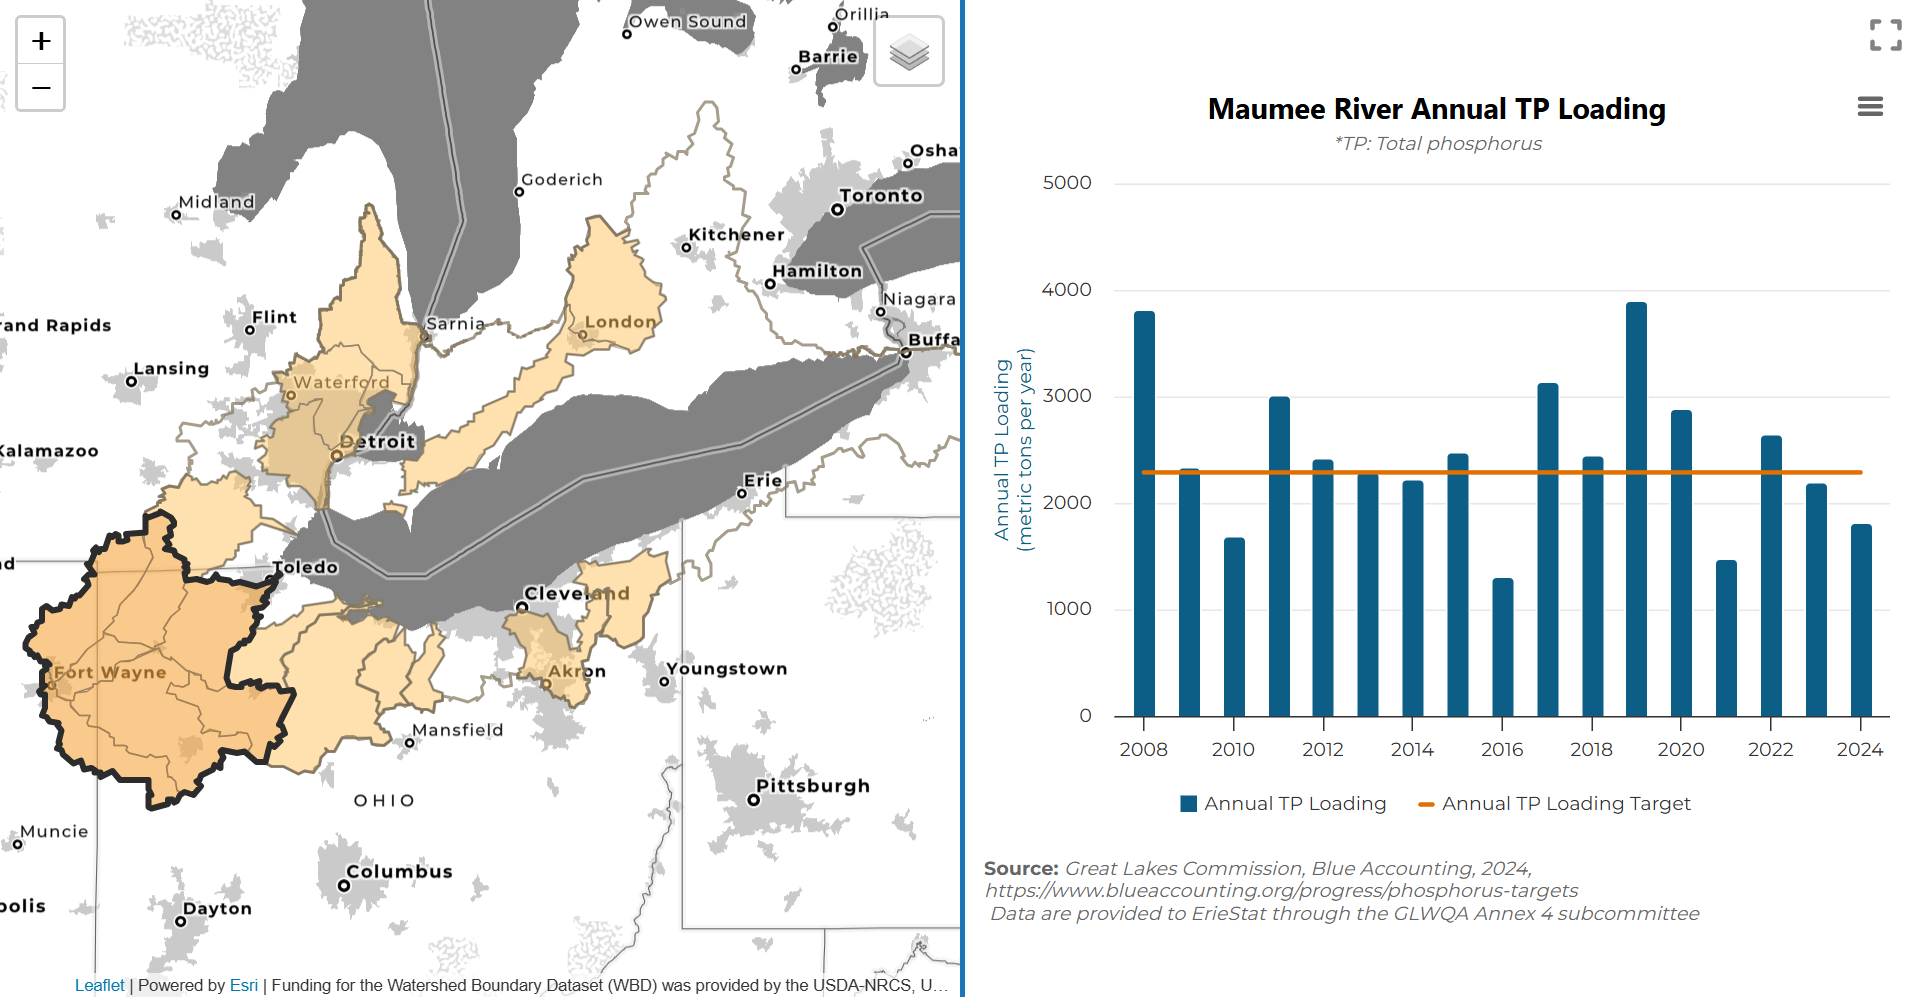
The U.S. and Canada agreed to limit the total phosphorus (TP) load to Lake Erie’s central basin, which includes inputs from the St. Clair-Detroit River corridor, to 6,000 metric tons per year (MTA). This was based on modeling of the hypoxic (low oxygen) zone in the lake. The modeling indicated that 6,000 MTA is the maximum load that would result in an acceptable dissolved oxygen concentration of at least 2 milligrams per liter in the bottom waters during the summer stratified period. This means that during the warmest months of the year, oxygen in Lake Erie’s water would be high enough to reduce the “dead zone” that has been cause for concern in recent years. Ten priority watersheds were identified and assigned a target to reduce annual total phosphorus loads to 40 percent of the 2008 load, by water year (October-September). With the exception of the Detroit River connecting channel, these loads are estimated at the mouth of the tributary, using three pieces of information: 1) water quality monitoring data collected at the most downstream stream gage for the river; 2) reported data for point source dischargers beyond this point; an 3) an estimate for the unmonitored area beyond the gage, using a simple ratio for unit-area load. The Detroit River is not monitored directly; instead the load is computed as a sum of upstream tributary loadings and point source discharges. Click on the watershed of interest to see available data.
Source:
Data are provided to the Great Lakes Commission through the GLWQA Annex 4 subcommittee
| River | Water Year | TP Load |
|---|---|---|
| Maumee River | 2022 | Target not met |
| Portage River | 2022 | Target not met |
| River Raisin | 2022 | Target not met |
| Sandusky River | 2022 | Target not met |
| Vermilion River | 2022 | Target met |
| Cuyahoga River | 2022 | Target met |
| Detroit River | 2022 | Target met |
| Grand River (OH) | 2022 | Target not met |
| Huron River (OH) | 2022 | Target not met |
| Thames River | 2022 | No Target |
Source:
ErieStat Work Group