
Source water planning
Tracking the existence of source water protection plans for the region’s community water supplies.
Tracking the existence of source water protection plans for the region’s community water supplies.
Tracking percentages of community water supplies meeting treatment requirements.
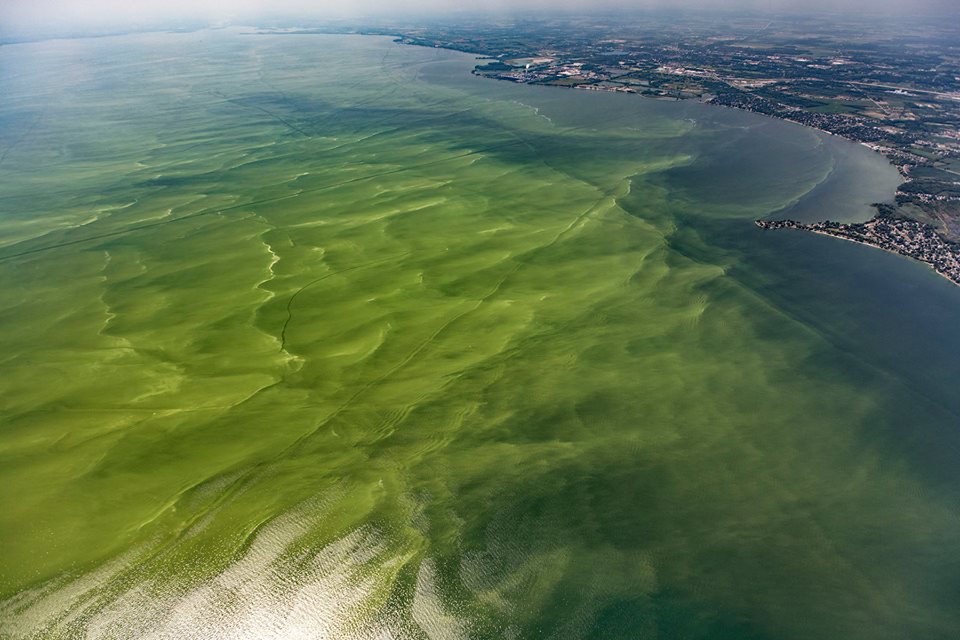
Tracking the severity of the cyanobacterial harmful algal bloom (HAB) in western Lake Erie
Tracking progress in implementing policies to reduce lead exposure from drinking water sources.
Tracking the annual amounts of phosphorus contributed to Lake Erie by ten priority rivers to the western and central basins of the lake. Limiting the annual total phosphorus load helps keep oxygen concentrations in the bottom waters of Lake Erie at an acceptable level and avoid hypoxia or “dead zones.”
Tracking the amounts of phosphorus contributed to Lake Erie by eight priority rivers in the spring (March 1 through July 31) by year. Rain and snowmelt during this season drive bloom severity later in the summer.
Tracking work to implement activities under Domestic Action Plans for the reduction of phosphorus in Lake Erie. Domestic Action Plans are “road maps” for phosphorus control efforts being undertaken by states, the province of Ontario, and both federal governments under the Great Lakes Water Quality Agreement.

Assessing regional consistency in the regulatory policies to restrict the introduction and spread of priority aquatic invasive species.